Analyzing Economic Indicators: Are We Headed for a Recession?
The state of the economy is always a subject of intense interest, especially in the world of finance and economics. It serves as a barometer for businesses, policymakers, and individuals, guiding their decisions and strategies. One critical question often asked is, "Are we headed for a recession?" In this article, we'll delve into various economic indicators to gain insight into the current economic situation and explore whether a recession is looming.
1. Understanding the Yield Curve
One of the most reliable indicators that economists and investors use to gauge the likelihood of a recession is the yield curve. Specifically, the yield curve's inversion, which has a track record of accurately predicting economic downturns.
The yield curve represents the relationship between short-term and long-term interest rates. Historically, when the yield on long-term bonds falls below that of short-term bonds, an inversion occurs, signaling a potential economic downturn. This inversion tends to precede recessions, offering a valuable early warning.

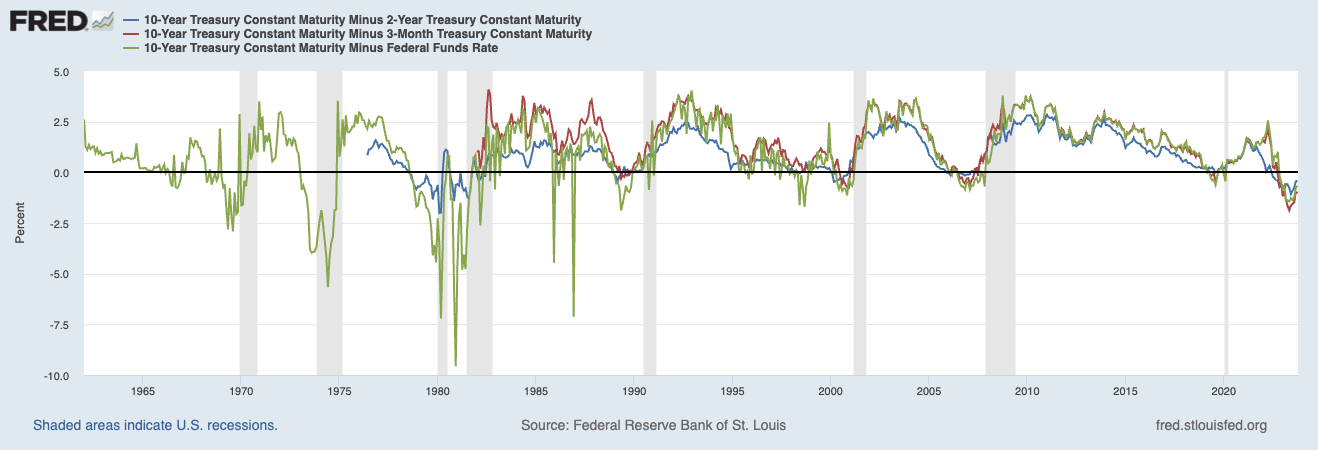
The data going back to 1954, as shown above, illustrates the pattern clearly. It shows that whenever the green line (the Federal Funds Rate) is above the red line (the 10-year US Treasury yield), an inversion occurs, and a recession follows. The data underscores the effectiveness of this indicator, with 7 out of 8 recessions accurately predicted.
a. Federal Reserve's Role in Economic Stability
The Federal Reserve plays a crucial role in shaping the economic landscape through its monetary policy decisions, especially regarding the federal funds rate. The fed funds rate is a pivotal interest rate that influences borrowing costs throughout the economy.
Analyzing the Fed funds rate in conjunction with long-term bond yields provides insights into the direction of the economy. As seen historically, an inversion between the two tends to precede recessions, making it a vital tool for economists and investors to monitor.
b. Real Estate and Commercial Impact
Mortgage rates, particularly the 30-year fixed rate, hold significant sway over the real estate market. When mortgage rates rise rapidly, it can have a profound impact on homeownership and the commercial real estate industry.
The chart above points to the importance of monitoring mortgage rates. The rise in mortgage rates, which has been observed since March 2020, affects the real estate sector, particularly commercial real estate. This impact is significant as it hampers the profitability of office buildings, which rely on cash flow, primarily driven by occupancy rates. Refinancing difficulties in this sector further highlight the economic challenges.
2. Inversions in Different Forms and Predicting Recessions
The data on yield curve inversions, including the 10-year minus 2-year, 10-year minus 3-month, and 10-year minus federal funds rate spreads, plays a pivotal role in economic forecasting. These indicators, with the 10-year minus 2-year shown in blue in the chart below, have consistently demonstrated their ability to anticipate economic recessions.
a. When Can a Recession Be Predicted?
An inverted yield curve, where short-term interest rates (e.g., 2-year Treasury yields) surpass long-term rates (e.g., 10-year Treasury yields), is a potent predictor of impending economic recessions. The lead time for these inversions can vary, with some occurring just months before a recession and others signaling potential downturns up to two years in advance. The 10-year minus 2-year yield curve, in particular, has a strong track record of accurately foreshadowing economic contractions.
The ability to predict a recession hinges on specific economic events, particularly the inversion of the yield curve. In the chart above, the 10-year minus 2-year yield curve inversion, represented in blue, stands out as a key indicator. When this curve inverts, with short-term interest rates surpassing long-term rates, it serves as a crucial signal for an impending recession. The lead time for such inversions varies; they can precede a recession by a few months or up to two years, offering vital early warnings to economists, policymakers, and investors.
3. Bankruptcy Filings: A Telling Statistic
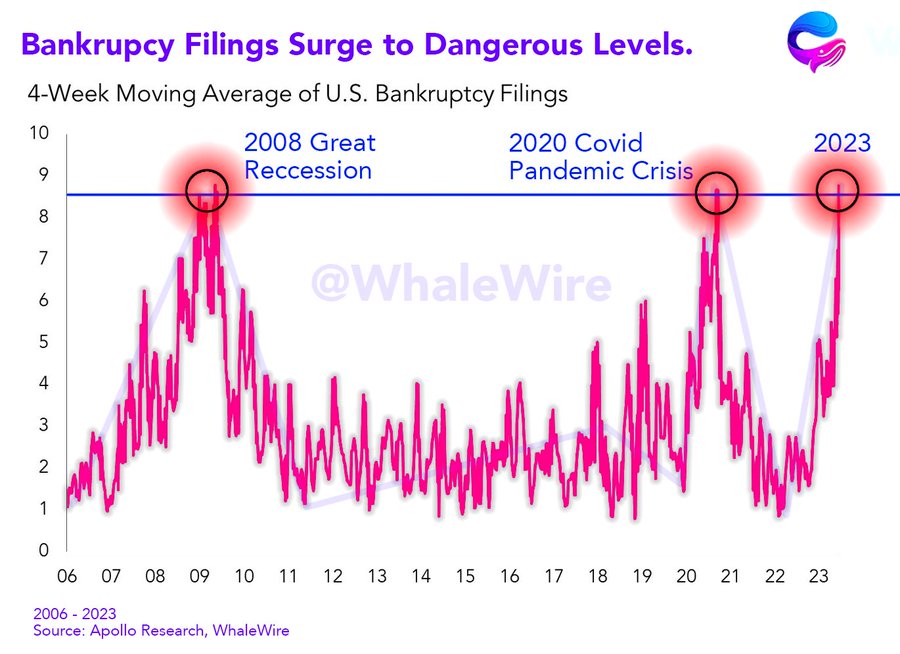
Bankruptcy filings are a critical economic indicator that sheds light on the financial health of individuals and businesses. The number of bankruptcy filings can serve as a barometer for economic distress and uncertainties. Let's delve into the data provided below and explore the significance of bankruptcy filings as a telling statistic:
a. Historical Bankruptcy Data
The data indicates that bankruptcy filings have surged to levels considered dangerous, comparable to those seen during previous economic crises. The statistics reveal that bankruptcy filings are at their highest levels since the onset of the 2008 Great Recession, a period that triggered the global financial crisis.
b. What the Numbers Signify
- Economic Stress: The rising number of bankruptcy filings is a stark indicator of economic stress. It showcases the challenges that individuals and businesses are facing in meeting their financial obligations.
- Leading Economic Indicator: Bankruptcy filings often function as a leading economic indicator, foreshadowing broader economic trends. When bankruptcy rates increase, it can be a harbinger of an impending economic downturn. This is because bankruptcy filings often result from financial difficulties stemming from a weak demand in the market, low consumer confidence, or excessive personal and business debt.
- Credit Market Insights: Bankruptcy data provides valuable insights into the credit market. A surge in bankruptcies indicates a higher likelihood of creditors facing losses, which can, in turn, impact lending practices. Lenders may tighten their credit standards and reduce lending, affecting the overall availability of credit in the economy.
4. Consumer Behavior and Discretionary Spending
When it comes to assessing economic well-being, observing consumer behavior, particularly with regards to discretionary spending, is paramount. My observation of restaurants during midweek and leisure activities in the city experiencing a slowdown provides a firsthand perspective of a potential shift in consumer behavior driven by economic concerns.
Beyond personal experiences, it's crucial to keep an eye on more comprehensive consumer spending metrics. Tracking data like retail sales and consumer confidence indices in your place of stay can provide a broader view of the economic landscape, helping to gauge an overall financial health of the region.
5. Bond Prices and Economic Impact
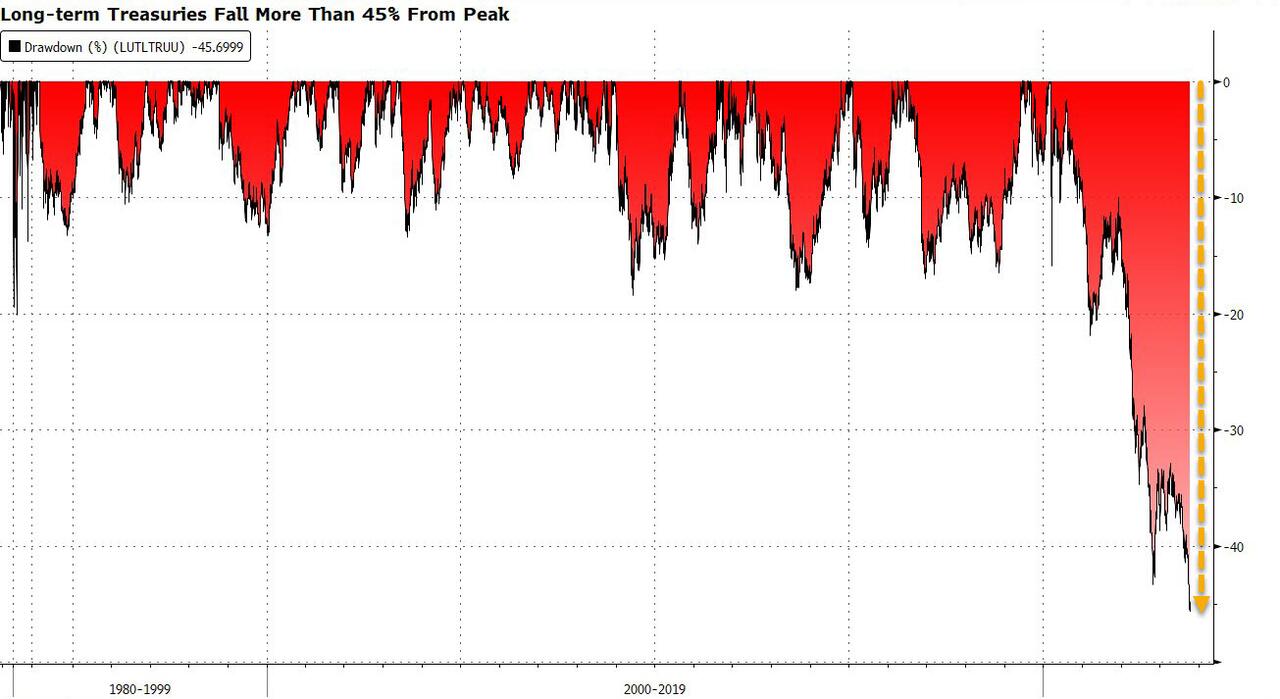
The recent surge in US bond yields, a less-publicized but critical economic indicator, demands attention. US Treasury Secretary Janet Yellen has had to address this issue as yields approach a critical threshold, despite minimal market intervention by the Federal Reserve.
a. The Situation: While the Federal Reserve halted interest rate hikes in July, US debt yields have surged, increasing by nearly 100 basis points independently of the Fed's actions. This defies expectations that yields closely follow the Fed's rates. Presently, bond yields are at their highest since 2007, before the sub-prime crisis, with 10-year treasuries falling 46%, and 30-year bonds down 53%, marking the worst performance in over 240 years of US government debt issuance.
b. Economic Implications: Falling bond prices can signify economic uncertainty, influencing borrowing costs and credit availability, impacting the broader economy.
c. Policy Relevance: Policymakers and central banks closely monitor bond prices, making policy decisions based on bond market movements to maintain economic stability.
6. Predicting Recessions: Insights from Government Tax Receipts
The analysis of federal government tax receipts provides a compelling historical perspective on predicting recessions. By tracking the percentage change in tax revenues in the United States since 1948, a distinct pattern emerges. Whenever tax revenues dip into negative territory, it reliably foreshadows economic recessions.
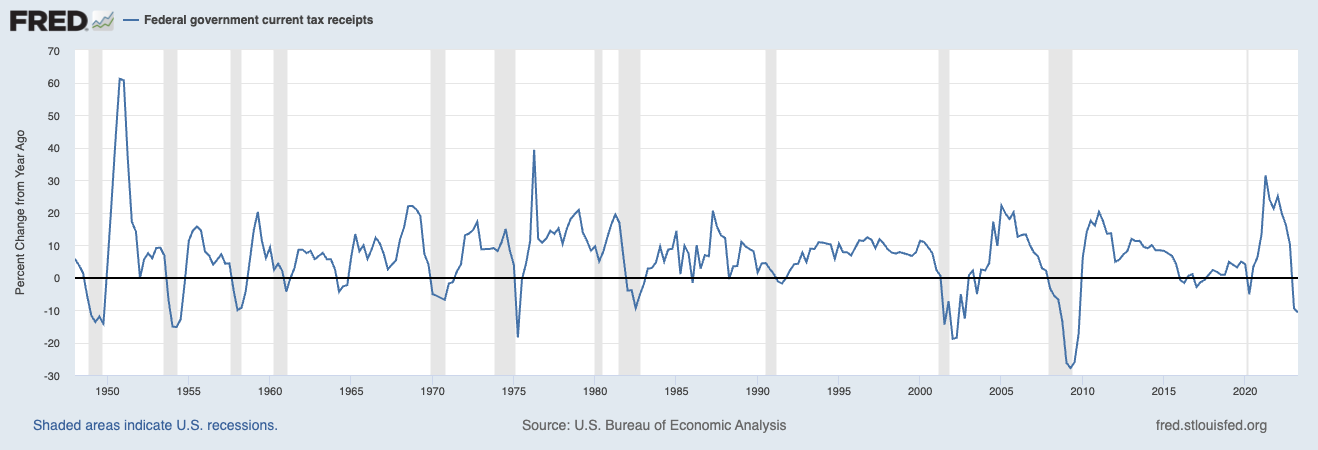
This indicator has demonstrated exceptional accuracy in signaling economic downturns, often predicting them just before they occur, in the midst of a recession, or shortly after it ends. Out of 12 recessions, it correctly anticipated 11, with only two instances of false alarms and one case where it missed the mark. This underscores the effectiveness of monitoring tax receipt trends as a reliable tool for gauging recessionary conditions. These indicators serve as trailing indicators, revealing the recession's existence only six months to a year after it begins, but they are nonetheless invaluable in understanding the broader economic landscape.
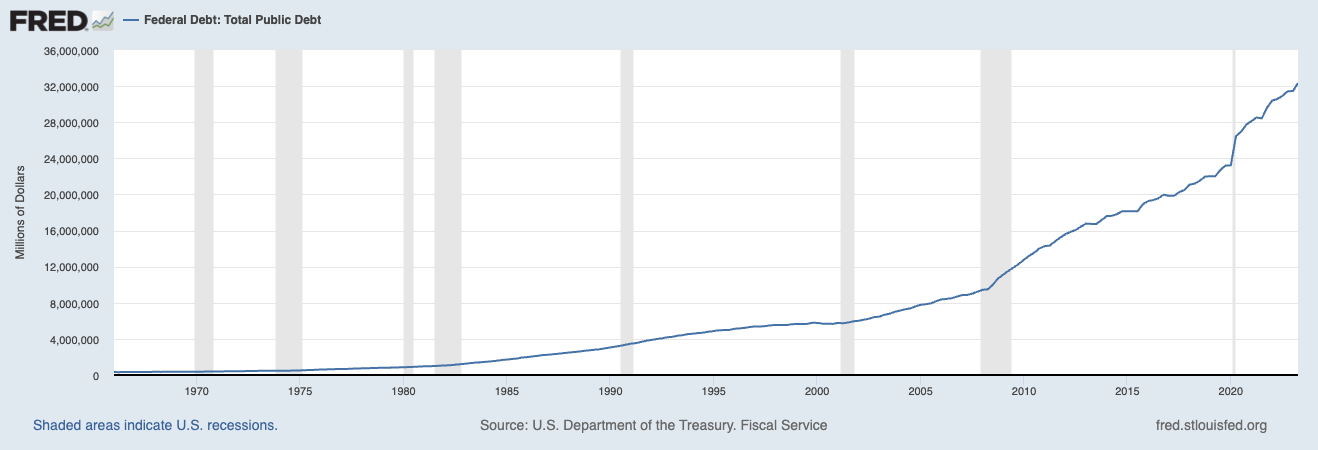
7. Debt Clock Ticks: Alarming Trends in National Debt and Economic Indicators
The ever-ticking national debt clock is sounding a warning amidst a peculiar financial landscape. While the figures representing the national debt, which has soared to nearly $33 trillion, continue to surge, they are accelerating at unprecedented rates, adding another $513 billion over the past 18 days alone (data as of Oct 8). This rapid accumulation of debt is occurring simultaneously with the troubling trend of other economic indicators moving in the opposite direction. Factors like currency supply, tax revenues, and credit card debt are all receding at remarkable speeds, reflecting an intricate interplay within the economy.

This incongruity, with national debt surging by over 25% since 2020, suggests that as the national debt expands, other critical economic metrics are collapsing, creating a precarious financial situation. For instance, tax revenues have shown a significant drop, with a recent decline of 12% compared to the prior year. The total credit card debt in the U.S. has reached unprecedented levels, nearing $1.1 trillion, which presents a contrasting picture to the soaring national debt figures. While the currency supply remains in focus, its decrease, coupled with the swift growth in national debt, heightens concerns about financial stability.

The urgent expansion of debt, now approaching $33 trillion, raises concerns about the motivations of politicians who may sense an impending endgame. Their strategy seems to involve a reckless spending spree, as seen in the cancellation of $127 billion in student debt for nearly 3.6 million Americans. This raises questions about who bears the cost of these financial maneuvers, with the average taxpayer, numbering around 127 million, paying an estimated $1,000 for this educational relief. This redistribution of wealth and unbridled spending leave many questions about fiscal responsibility and the future economic landscape, with concerns about a looming currency crisis and market collapse. Government interventions and policy decisions can significantly impact economic conditions. For instance, when governments forgive student debt or introduce other forms of financial stimulus, the repercussions extend to taxpayers and the broader economy. The distribution of the burden and benefits of such measures is a matter of great debate and analysis.
8. The Dangers of Fiscal Irresponsibility
Economists like Thomas Sowell and Milton Friedman emphasize the importance of fiscal responsibility and the potential pitfalls of government intervention. They argue that you cannot subsidize irresponsibility without expecting adverse consequences. In the case of student debt forgiveness, the cost is shouldered by taxpayers and carries broader implications for economic stability.
9. Milton Friedman's Insight on Government Spending

Friedman's opinion serves as a stark reminder that the true tax burden isn't solely imposed through explicit taxes. It is also inflicted indirectly through inflation or borrowing. The paramount concern lies in government spending, as it dictates our financial buoyancy. Friedman's timeless advice urges us to focus on limiting government spending as a proportion of our income. By doing so, we can alleviate concerns about mounting debt and its associated risks. This underscores the notion that excessive government expenditure acts as an anchor, making it harder for individuals and businesses to stay financially afloat.
Conclusion
This comprehensive analysis has delved into a myriad of economic indicators that economists and investors rely on to gauge the potential onset of a recession. From the intriguing behavior of the yield curve to the significant impact of government policies, these elements collectively shape the intricate tapestry of our economic landscape.
In an era characterized by economic intricacies, the capacity to decode and interpret these indicators is paramount. The precision of our forecasts and the wisdom of our financial decisions hinge on our aptitude to closely observe and comprehend the economic cues presented to us. Whether a recession looms on the horizon or retreats into the background, the crux lies in our ability to stay well-informed and adaptable when confronted with the challenges of an ever-evolving economic environment. It is in this dynamic landscape that our financial acumen and astuteness truly shine.